Chapter6 비지도 학습
- 비지도 학습은 타깃이 없을 때 사용하는 머신러닝 알고리즘이다.
군집 알고리즘
1
2
3
4
5
6
| # 데이터 로드
import numpy as np
import matplotlib.pyplot as plt
fruits = np.load('fruits_300.npy)
print(fruits.shape)
>>> (300 , 100 , 100) #의미는 300개의 샘플이 100높이로 100 너비의 크기를 갖는다.
|
1
2
3
4
5
6
| # 첫번째 이미지의 첫 번째 행 출력
print(fruits[0,0,:])
#numpy 배열로 저장된 이미지 그리기
plt.imshow(fruits[0]),cmap='gray'
plt.show()
|
1
2
3
| # 색 반전 시키기
plt.imshow(fruits[0],cmap='gray_r')
plt.show()
|
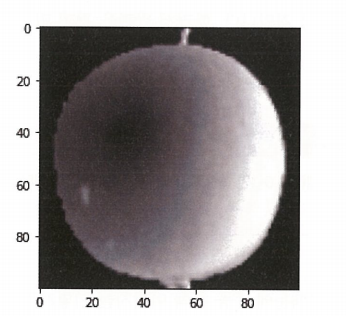
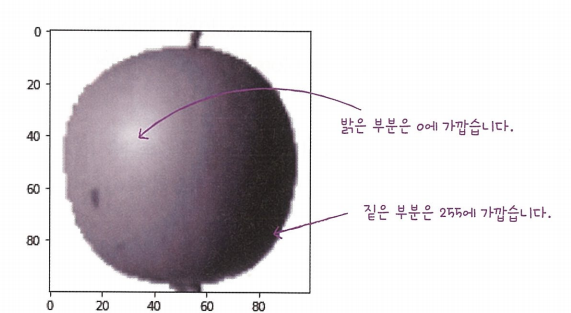
왜 색을 반전 시키는가? 0은 행렬의 곱셈,덧셈에서 의미가 없기에 사과를 식별하기 위해 색을 반전시키는 것이 좋다.
1
2
3
4
5
| #파인애플, 바나나 이미지 출력
fig,axs = plt.subplots(1,2)
axs[0].imshow(fruits[100]),cmap='gray_r)
axs[1].imshow(fruits[200]),cmap='gray_r)
plt.show()
|
픽셀값 분석하기
픽셀값을 분석하기 위해서는 1차원 배열로 바꾸는 것이 계산에 용이하다.
1
2
3
4
5
6
| # 사과 1차원 배열로 바꾸기
apple = fruits[0:100].reshape(-1,100*100)
pineapple =fruits[100:200].reshape(-1,100*100)
banana = fruits[200:300].reshape(-1,100*100)
print(apple.shape)
>>>(100,10000)
|
1
2
| # axis1은 열 단위를 의미
print(apple.mean(axis=1)) #열 단위로 평균을 냄
|
1
2
3
4
5
6
| # 히스토그램 그려보기
plt.hist(np.mean(apple,axis=1),alpha=0.8)
plt.hist(np.mean(pineapple,axis=1),alpha=0.8)
plt.hist(np.mean(banana,axis=1),alpha=0.8)
plt.legend(['apple','pineapple','banana'])
plt.show()
|
위의 히스토그램은 샘플의 평균값을 구한 것이다. 픽셀별 평균값을 비교하는 코드는 밑에 있다.
1
2
3
4
5
6
| #픽셀의 평균값 비교
fig,axs=plt.subplots(1,3,figsize=(20,5))
axs[0].bar(range(10000)),np.mean(apple,axis=0))
axs[1].bar(range(10000)),np.mean(pineapple,axis=0))
axs[2].bar(range(10000)),np.mean(banana,axis=0))
plt.show()
|
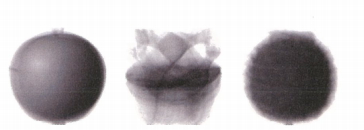
픽셀 평균값을 100*100으로 바꿔서 이미지로 출력 한 후 그래프와 비교하면 좋다
1
2
3
4
5
6
7
8
9
10
11
|
#픽셀 평균값 100*100 배열로 전환
apple_mean = np.mean(apple,axis=0).reshape(100,100)
pineapple_mean = np.mean(pineapple,axis=0).reshape(100,100)
banana_mean =np.mean(banana,axis=0).reshape(100,100)
fig,axs=plt.subplots(1,3,figsize=(20,5))
axs[0].imshow(apple_mean,cmap='gray_r)
axs[1].imshow(pineapple_mean,cmap='gray_r)
axs[2].imshow(banana_mean,cmap='gray_r)
plt.show()
|
평균값과 가까운 사진 고르기
1
2
3
4
5
6
7
8
9
10
11
12
13
14
15
16
| #절댓값 오차를 사용한 평균값과 가까운 사진 고르기
abs_diff = np.abs(fruits-apple_mean)
abs_mean= np.mean(abs_diff,axis(1,2))
print(abs_mean.shape)
>>>(300,)
# 절댓값 오차가 작은 100개 선택
apple_index =np.argsort(abs_mean)[:100]
fig, as =plt.subplots(10,10,figsize=(10,10))
for i in range(10):
for j in range(10):
axs[i,j].imshow(fruits[apple_index[i*10+j]],cmap='gray_r')
axs[i,j].axis('off')
plt.show()
|
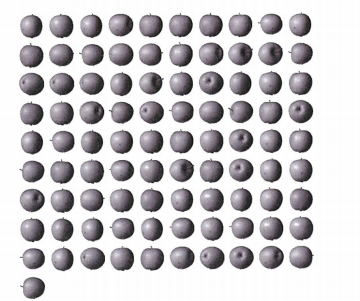
이처럼 비슷한 샘플끼리 그룹으로 모으는 작업을 군집이라고 한다. 군집은 대표적인 비지도 학습 작업 중 하나이다. 군집 알고리즘에서 만든 그룹을 클러스터라고 부른다.
K-Means
k-means 군집 알고리즘은 평균값을 자동으로 찾아준다.
이 평균값이 클러스터의 중심에 위치하기 때문에 클러스터링 중심(cluster center)또는 센트로이드(centroid)라고 부른다.
k-means algorithm
작동방식
1.무작위로 k개의 클러스터 중심을 정한다.
2.각 샘플에서 가장 가까운 클러스터 중심을 찾아 해당 클러스터의 샘플로 지정한다.
3.클러스터에 속한 샘플의 평균값으로 클러스터 중심을 변경한다. 4.클러스터 중심에 변화가 없을 때까지 2번으로 돌아가 반복한다
1
2
3
| import numpy as np
fruits = np.load('fruits_30.npy)
furits_2d = fruits.reshape(-1,100*100)
|
1
2
3
4
5
| from skleanr.cluster import KMeans
km = KMeans(n_clusters=3,random_state = 42)
km.fit(fruits_2d)
print(km.labels_)
print(np.unique(km.lables_,return_counts=True))
|
1
| >>> (array([0,1,2],dtype =int32)) , array([91 , 98 , 111])
|
결과를 보면 라벨0 =91개 라벨 1=98개 라벨2 =111개의 결과를 알 수 있다
1
2
3
4
5
6
7
8
9
10
11
12
13
14
| # 시각화 해보기
import matplotlib.pyplot as plt
def draw_fruits(arr,ratio=1):
n= len(arr) #n은 샘플 수
# 한 줄에 10개씩 이미지 그리기. 샘플 개수를 10으로 나누어 전체 행 개수 계산
rows = int(np.ceil(n/10))
cols=n if rows <2 else 10
fig, axs = plt.subplots(rows , cols , figsize = (cols*ratio, rows*ratio), squeeze =False)
for i in range (rows):
for j in range(cols):
if i*10 +j<n:
axs[i,j].imshow(arr[i*10j]),cmap='gray_r')
axs[i,j].axis('off')
plt.show()
|
1
| draw_fruits(fruits(fruits[km.labels_==0]))
|
이와 마찬가지로 다른 클러스터도 확인 할 수 있다.
클러스터 중심
KMeans 클래스가 최종적으로 찾는 클러스터 중심은 cluster_centers_속성에 저장되어 있다. 이를 출력하기 위해서는 100*100 크기의 2차원 배열로 바꿔야 함.
1
| draw_fruits(km.cluster_centers_.reshape(-1,100,100),ratio=3)
|
1
2
3
4
5
|
# 훈련 데이터 샘플에서 클러스트 중심까지 거리 변환
print(km.transform(fruits_2d[100,101]))
>>> [[5267.70439881 8837.37750892 3393.8136117]]
|
1
2
3
| print(km.predict(fruits_2d[100:101]))
>>> [2]
|
1
| draw_fruits(fruits[100:101])
|
1
2
3
4
| #최적의 클러스터를 위한 반복 횟수 출력
print(km.n_iter_)
>>> 3
|
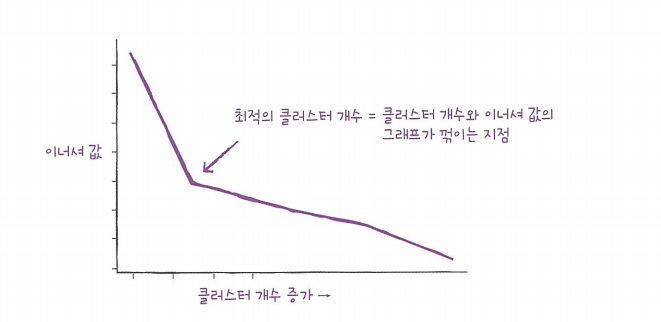
최적의 k 찾기
k-means의 단점은 사전에 클러스터 개수를 지정해야한다는 것이다.
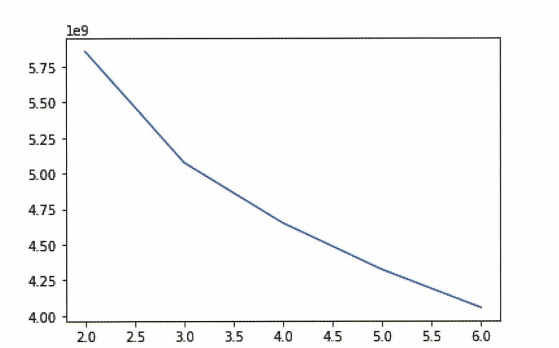
이너셔(inertia)는 k-means 알고리즘에서 클러스터 중심과 클러스터에 속한 샘플 사이의 거리를 잴 수 있다.
따라서 엘보우 방법은 클러스터 개수를 늘려가면서 이너셔의 변화를 관찰하여 최적의 클러스터 개수를 찾는 방법이다.
1
2
3
4
5
6
7
8
| # 이너셔와 엘보우의 관계 시각화
inertia = []
for k in range(2,7):
km = KMeans(n_clusters=k , random_state=42)
km.fit(fruits_2d)
inertia.append(km.inertia_)
plt.plot(range(2,7),inertia)
plt.show()
|
주성분 분석
차원과 차원 숙소
차원 축소는 데이터를 가장 잘 나타내는 일부 특성을 선택하여 데이터 크기를 줄이고 지도 학습 모델의 성능을 향상시킬 수 있는 방법이다.
주성분 분석 소개
주성분은 원본 차원과 같고 주성분으로 바꾼 데이터는 차원이 줄어든다.
주성분이 가장 분산이 큰 방향이기 떄문에 주성분에 투영하여 바꾼 데이터는 원본이 가지고 있는 특성을 가장 잘 나타내고 있을 것이다.
1
2
3
4
5
6
7
| import numpy as np
from sklearn.decomposition import PCA
fruits = np.load('fruits_300.npy')
#PCA 진행
fruits_2d = fruits.reshape(-1,100*100)
pca = PCA(n_components=50) #components는 정해줘야함
pca.fit(fruits_2d)
|
1
2
3
4
5
6
| print(pca.compoents_.shape)
>>> (50,10000)
```py
draw_fruits(pca.components_.reshape(-1,100,100))
|
1
2
3
4
| #기존 배열
print(fruits_2d.shape)
>>> (300,10000)
|
1
2
3
4
5
| fruits_pca = pca.transform(fruits_2d)
print(fruits_pca.shape)
>>> (300,50)
|
원본 데이터 재구성
데이터의 특성을 줄이면 특성의 손실이 발생할 수 밖에 없다. 하지만 최대한 분산이 큰 방향으로 데이터를 투영했기 떄문에 원본 데이터를 상당 부분 재구성할 수있다.
1
2
3
4
5
6
| # 원본 데이터 재구성
fruits_inverse = pca.inverse_transform(fruits_pca)
print(fruits_invers.shape)
>>> (300,10000)
|
설명된 분산
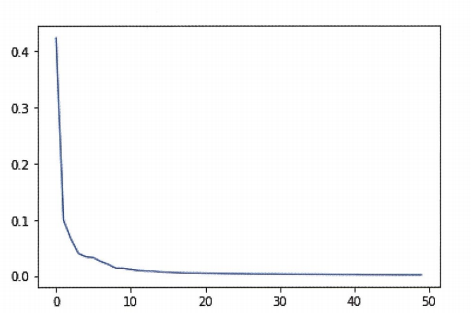
설명된 분산(explained variance)는 주성분이 원본 데이터의 분산을 얼마나 잘 나타내는지 기록한 값이다
1
2
3
4
5
6
7
| #주성분의 설명된 분산 비율 출력
print(np.sum(pca.explained_variance_ratio_))
>>>0.9215651897863715
# 설명된 분산 그래프로 출력
plt.plot(pca.explained_variance_ratio)
|
결과를 해석하자면, 처음 10개의 주성분이 대부분의 분산을 표현하고 있다.
다른 알고리즘과 함께 사용하기
1
2
3
4
5
6
7
|
from sklearn.linear_model import LogisticRegression
lr = LogisticRegression()
target = np.array([0] * 100 + [1] * 100 + [2] * 100)
|
1
2
3
4
5
6
7
8
9
10
| #PCA 제외 예측 결과
from sklearn.model_selection import cross_validate
scores = cross_validate(lr, fruits_2d, target)
print(np.mean(scores['test_score']))
print(np.mean(scores['fit_time']))
>>>
0.9966666666666667
1.819899892807007
|
1
2
3
4
5
6
7
8
| #PCA 예측 결과
scores = cross_validate(lr, fruits_pca, target)
print(np.mean(scores['test_score']))
print(np.mean(scores['fit_time']))
>>>
1.0
0.032833099365234375
|
두 결과가 비슷함 그러나 시간적인 측면에서 pca분석이 이익이다.
1
2
3
4
5
|
fruits_pca = pca.transform(fruits_2d)
print(fruits_pca.shape)
>>> (300, 2)
|
1
2
3
4
5
6
7
| #2개의 주성분만 가지고 분석
scores = cross_validate(lr, fruits_pca, target)
print(np.mean(scores['test_score']))
print(np.mean(scores['fit_time']))
>>> 0.9933333333333334
0.03713240623474121
|
주성분 분석으로 차원 축소
차원 축소를 사용하면 데이터 셋의 크기를 줄일 수 있고 시각화하기 쉽다는 장점이 있다. 똫차원 축소된 데이터를 지도 학습 알고리즘이나 다른 비지도 학습 알고리즘에 재사용하여 성능을 높이거나 훈련속도를 빠르게 만들 수 있다.
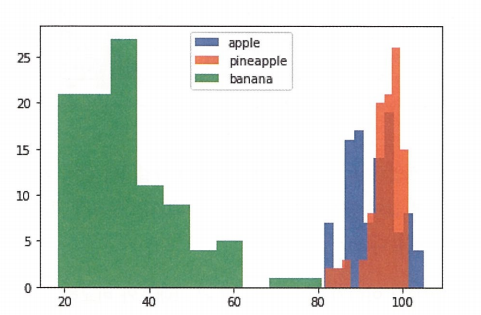 위의 히스토그램은 샘플의 평균값을 구한 것이다. 픽셀별 평균값을 비교하는 코드는 밑에 있다.
