K-NN Model & Data Preprocessing
K-NN Model & Data Preprocessing
Chapter 2. 데이터 다루기
지도학습과 비지도 학습
- 지도학습은 정답(라벨링)이 필요하다.
- 지도 학습에서는 데이터와 정답을 입력(input)과 타깃(target)이라 함 이를 합쳐서 훈련데이터(training set)이라 부른다.
- Target 변수를 제외한 나머지 독립변수들을 특성(Feature)이라 한다.
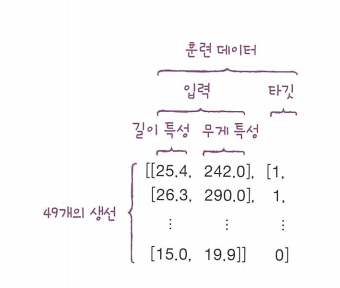
- 만약 정답이 없으면 비지도 학습 알고리즘을 사용해야 한다.
훈련세트와 테스트 세트
- 준비된 데이터 셋을 Test set과 Train set으로 나누어 평가하는 것이 일반적이다. 보통 이미 준비된 데이터 중 일부를 떼어내어 활용한 것을 Test set보다는 Validation set이라고 부르는 것이 일반적이고 새로 들어온 데이터를 Test set이라고 부르는 것이 일반적이긴 하다.
- 49개의 샘플 데이터 불러오기
1
2
3
4
5
6
 bream_length = [25.4, 26.3, 26.5, 29.0, 29.0, 29.7, 29.7, 30.0, 30.0, 30.7, 31.0, 31.0, 31.5, 32.0, 32.0, 32.0, 33.0, 33.0, 33.5, 33.5, 34.0, 34.0, 34.5, 35.0, 35.0, 35.0, 35.0, 36.0, 36.0, 37.0, 38.5, 38.5, 39.5, 41.0, 41.0]

 bream_weight = [242.0, 290.0, 340.0, 363.0, 430.0, 450.0, 500.0, 390.0, 450.0, 500.0, 475.0, 500.0, 500.0, 340.0, 600.0, 600.0, 700.0, 700.0, 610.0, 650.0, 575.0, 685.0, 620.0, 680.0, 700.0, 725.0, 720.0, 714.0, 850.0, 1000.0, 920.0, 955.0, 925.0, 975.0, 950.0]

 fish_data = [[l, w] for l, w in zip(bream_length, bream_weight)]
 fish_target = [1] * 35 + [0] * 14
- 불러온 데이터를 약 7:3으로 train set과 validation set으로 나누기
1
2
3
4
5
6
7
 from sklearn.neighbors import KNeighborsClassifier
 kn = KNeighborsClassifier()
 # slicing을 통한 데이터셋 분리
 train_input = fish_data[:35]
 train_target = fish_target[:35]
 test_input = fish_data[35:]
 test_target = fish_target[35:]
- 모델 평가
1
2
 kn = kn.fit(train_input, train_target)
 kn.score(test_input, test_target)  # 결과 0.0
- random sampling을 해야 결과 0.0이 사라짐.
- sampling bias(샘플링 편향)을 없애기 위해 numpy를 활용하여 데이터 셋을 섞어야 한다.
1
2
3
4
5
6
7
 import numpy as np
 input_arr = np.array(fish_data)
 target_arr = np.array(fish_target)

 np.random.seed(123)
 index = np.arange(49)
 np.random.shuffle(index)
이를 활용하여 input과 target 섞기
1
2
3
4
5
 train_input = input_arr[index[:35]]
 train_target = target_arr[index[:35]]

 test_input = input_arr[index[35:]]
 test_target = target_arr[index[35:]]
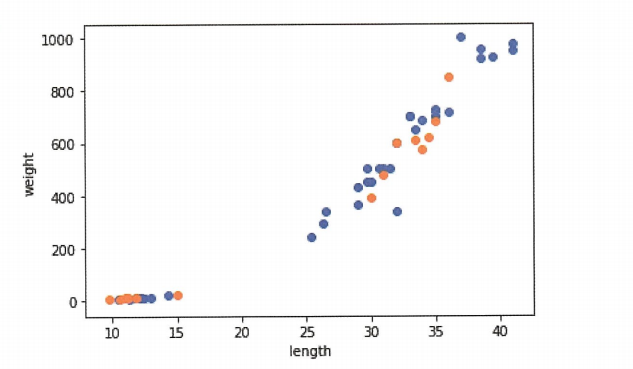
- 산점도로 잘 섞였는지 시각화
1
2
3
4
5
6
 import matplotlib.pyplot as plt
 plt.scatter(train_input[:, 0], train_input[:, 1])
 plt.scatter(test_input[:, 0], test_input[:, 1])
 plt.xlabel('length')
 plt.ylabel('weight')
 plt.show()
결과를 보면 train set과 test set이 잘 mix된 것을 알 수 있다.
- random sampling 후 KNN 모델 이용
1
2
3
4
 kn = kn.fit(train_input, train_target)
 kn.score(test_input, test_target)
 kn.predict(test_input)
 test_target  # 결과 accuracy=1
데이터 전처리
올바른 결과 도출을 위해서 데이터를 사용하기 전에 데이터 전처리 과정을 거친다. 전처리 과정을 거친 데이터로 훈련했을 때의 차이를 알고 표준점수로 특성의 스케일을 변환하는 방법을 배운다.
1
2
3
  ### 데이터 셋 불러오기
  fish_length = [25.4, 26.3, 26.5, 29.0, 29.0, 29.7, 29.7, 30.0, 30.0, 30.7, 31.0, 31.0, 31.5, 32.0, 32.0, 32.0, 33.0, 33.0, 33.5, 33.5, 34.0, 34.0, 34.5, 35.0, 35.0, 35.0, 35.0, 36.0, 36.0, 37.0, 38.5, 38.5, 39.5, 41.0, 41.0, 9.8, 10.5, 10.6, 11.0, 11.2, 11.3, 11.8, 11.8, 12.0, 12.2, 12.4, 13.0, 14.3, 15.0]
  fish_weight = [242.0, 290.0, 340.0, 363.0, 430.0, 450.0, 500.0, 390.0, 450.0, 500.0, 475.0, 500.0, 500.0, 340.0, 600.0, 600.0, 700.0, 700.0, 610.0, 650.0, 575.0, 685.0, 620.0, 680.0, 700.0, 725.0, 720.0, 714.0, 850.0, 1000.0, 920.0, 955.0, 925.0, 975.0, 950.0, 6.7, 7.5, 7.0, 9.7, 9.8, 8.7, 10.0, 9.9, 9.8, 12.2, 13.4, 12.2, 19.7, 19.9]
Numpy를 활용한 데이터 전처리
1
2
3
4
5
6
7
```python
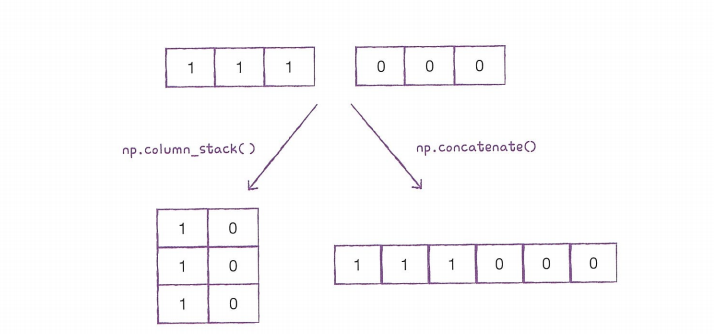
np.column_stack(([1, 2, 3], [4, 5, 6]))
# 결과는 처음 리스트와 두 번째 리스트의 원소의 위치에 알맞게 바뀌어 2차원 배열이 3*2의 행렬로 반환됨. 두 행을 붙인다고 생각하면 편함.
fish_data = np.column_stack((fish_length, fish_weight))
```
- 행으로 연결시키면 column_stack(), 열로 연결시키면 concatenate()
sklearn을 활용한 Random sampling
- 편리하게 train set과 test set을 나눌 수 있는 메소드 이용
1
2
3
  from sklearn.model_selection import train_test_split

  train_input, test_input, train_target, test_target = train_test_split(fish_data, fish_target, random_state=42)  # random sampling. 이때 매개변수 random_state를 설정하면 랜덤으로 데이터셋이 섞임.
- train, test에 대한 shape 보기
1
2
  print(train_input.shape, test_input.shape)
  # 결과는 (36, 2), (13, 2). 36*2, 13*2 행렬을 의미.
문제 발생: 도미와 빙어를 random sampling 했지만, Sampling bias가 나타남.
- 해결 방법은 train_test_split method에서 stratify 매개변수를 사용할 것!
1
  train_input, test_input, train_target, test_target = train_test_split(fish_data, fish_target, stratify=fish_target, random_state=42)  # 완벽히 5:5는 아니지만, 꽤 비슷한 비율로 맞출 수 있었음.
- 전처리한 데이터를 바탕으로 K-NN 모델 이용
1
2
3
4
5
  from sklearn.neighbors import KNeighborsClassifier
  kn = KNeighborsClassifier()
  kn.fit(train_input, train_target)
  kn.score(test_input, test_target)
  # 결과: 1.0
1
2
3
  print(kn.predict([[25, 150]]))
  # 결과가 틀리는 문제가 발생.
  # 결과: [0.]
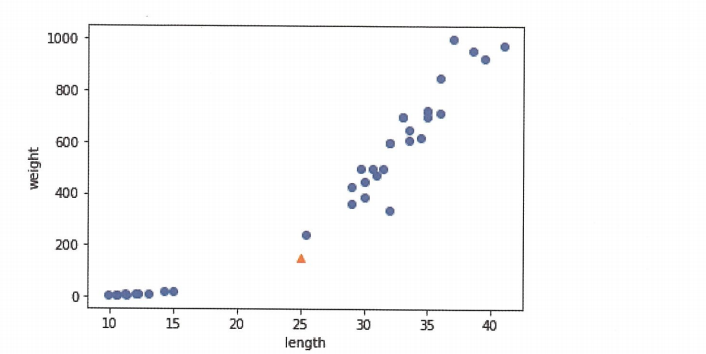
- 문제가 발생했기에 scatter를 그려봄
1
2
3
4
5
6
  import matplotlib.pyplot as plt
  plt.scatter(train_input[:, 0], train_input[:, 1])
  plt.scatter(25, 150, marker='^')  # marker 매개변수는 모양을 지정하는 것임.
  plt.xlabel('length')
  plt.ylabel('weight')
  plt.show()
- 산점도를 확인한 결과 KNeighborsClassifier 클래스는 주어진 샘플 중에서 가장 가까운 이웃을 찾아준다. 따라서 기본 Default n_neighbors=5이기 때문에 5개의 이웃이 반환 됨.
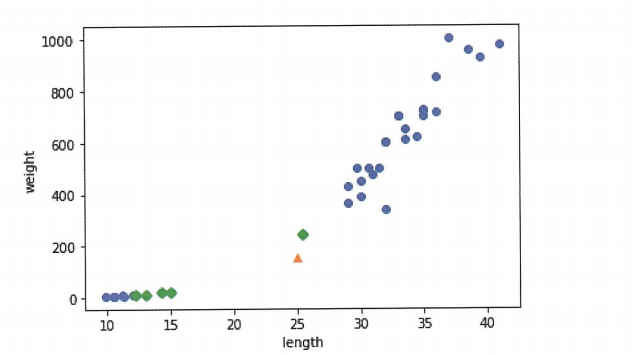
- 그러면 가장 가까운 5개를 알 수 있는 방법은 뭐가 있을까? 이 또한 산점도를 이용한다.
1
2
3
4
5
6
  plt.scatter(train_input[:, 0], train_input[:, 1])
  plt.scatter(25, 150, marker='^')
  indexes = kn.kneighbors([[25, 150]], return_distance=False)
  plt.scatter(train_input[indexes, 0], train_input[indexes, 1], marker='D')
  plt.xlabel('length')
  plt.ylabel('weight')
- 시각화를 해서 [25, 150]의 NN 5개를 확인할 수 있었음.
- 문제 해결 방법: 거리 확인한 후 모델 조정.
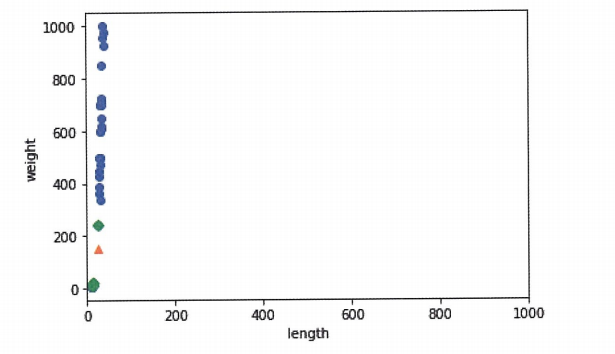
- 산점도에서 x, y축 범위 동일하게 조정
1
2
3
4
5
6
7
8
  plt.scatter(train_input[:, 0], train_input[:, 1])
  plt.scatter(25, 150, marker='^')
  indexes = kn.kneighbors([[25, 150]], return_distance=False)
  plt.scatter(train_input[indexes, 0], train_input[indexes, 1], marker='D')
  plt.xlim((0, 1000))
  plt.xlabel('length')
  plt.ylabel('weight')
  plt.show()
결과를 확인해보니, 생선의 길이보다는 생선의 무게만이 고려의 대상이 된다.
즉, 두 특성의 스케일이 다름을 알 수 있다. 데이터를 표현하는 기준이 다르면 알고리즘이 올바르게 예측할 수 없다. 알고리즘이 거리 기반일 때 더욱 그렇다. 따라서 데이터 Scaling이 필요하다.
z-score(표준점수) 사용하여 전처리
1
2
3
4
5
6
```python
mean = np.mean(train_input, axis=0)
std = np.std(train_input, axis=0)
train_scaled = (train_input - mean) / std
```
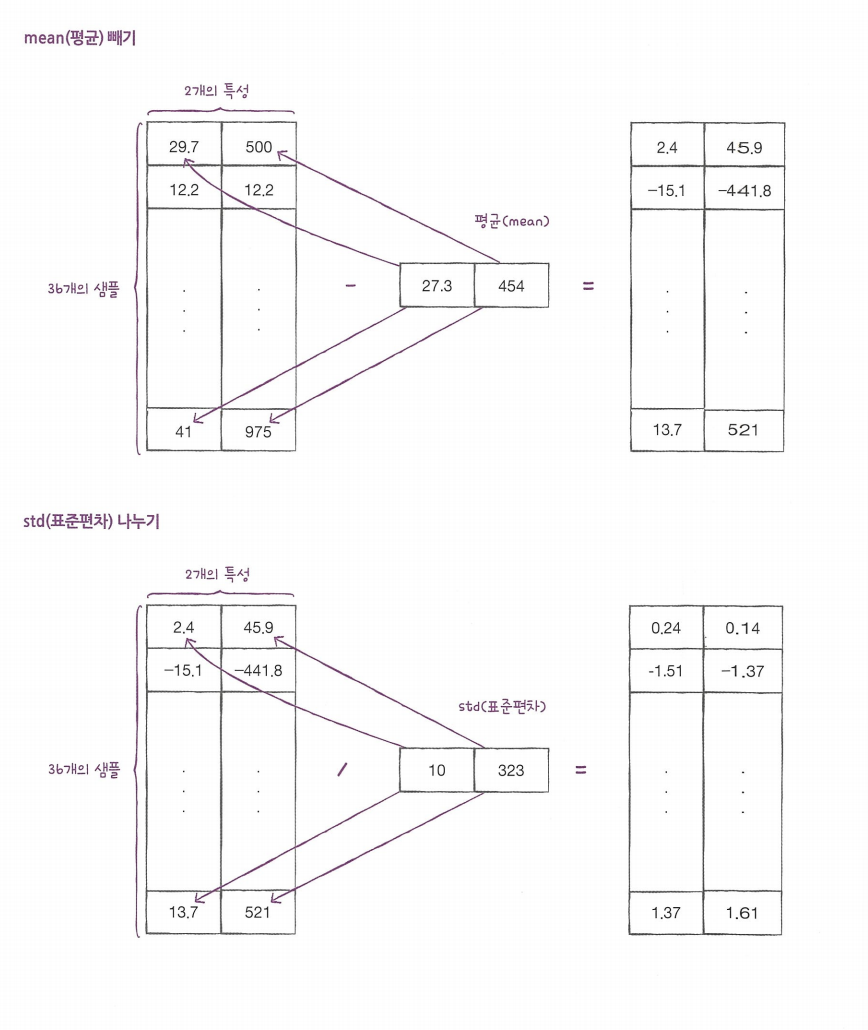
- 다시 산점도 그려보기
1
2
3
4
5
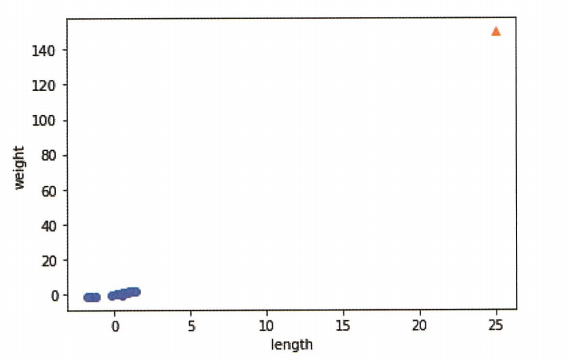
  plt.scatter(train_scaled[:, 0], train_scaled[:, 1])
  plt.scatter(25, 150, marker='^')
  plt.xlabel('length')
  plt.ylabel('weight')
  plt.show()
- 산점도를 그려본 결과, 왼쪽에 편향되어 있음. 또한 오른쪽 맨 위에 샘플 [25, 150]이 있음. 이를 해결하기 위해 똑같이 test sample도 표준화시켜야 함.
1
2
3
4
5
6
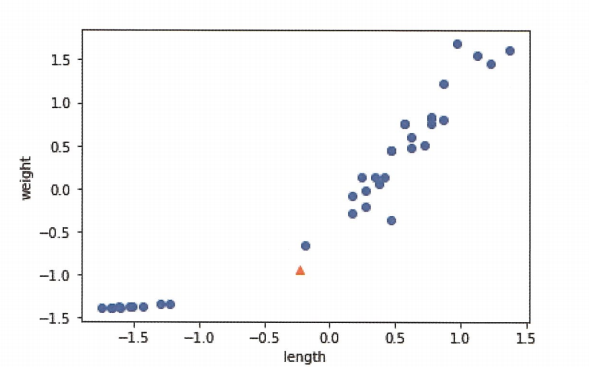
  new = ([25, 150] - mean) / std
  plt.scatter(train_scaled[:, 0], train_scaled[:, 1])
  plt.scatter(new[0], new[1], marker='^')
  plt.xlabel('length')
  plt.ylabel('weight')
  plt.show()
- 산점도 결과 x, y축이 scaling 됨.
이를 통해서 다시 k-nn 모델 훈련.
1
2
3
4
5
6
  kn.fit(train_scaled, train_target)  # 모델 훈련.
  test_scaled = (test_input - mean) / std  # 테스트 셋 스케일링.
  kn.score(test_scaled, test_target)  # 모델 평가.
  # 결과: 1.0

  print(kn.predict([new]))  # 결과: [1.]
데이터 스케일링이 모델의 성능을 좋게 할 수도 있다는 인사이트를 얻음.
This post is licensed under CC BY 4.0 by the author.
